Article
How To Tell If It’s Cheaper To Buy Than Rent Nearby
A step‑by‑step Australian guide to compare your local rent with realistic ownership costs, so you can see if buying, renting or rentvesting is the better move this year.
Key Takeaway
It’s cheaper to own than rent in your area when a realistic, stress‑tested mortgage plus ownership costs are similar to or lower than your current rent, using at least a 3% interest rate buffer and allowing for strata, maintenance and insurance. With around 28% of Australian mortgage holders already at risk of stress, borrowers should keep total repayments under 30–35% of after‑tax income and test at higher rates. A structured local rent‑versus‑buy comparison gives a clear, actionable answer this week.
Watch the short answer
Australian expats investing back home
If you are overseas and eyeing an Australian property, this clip shows how lenders may view your foreign income.
Read the transcript
Australian expats trying to invest back home face an incredibly frustrating barrier. Major banks use massive currency shading models that slash your real foreign income by up to 30% on paper, making you look like you can't afford a loan. We use cross-border specialist lenders who evaluate your actual global earnings without the penalising retail haircuts. Keep building your Australian portfolio. DM me 'EXPAT' to check your true capacity.
General information only, not personal advice. Your situation is assessed before any recommendation.

You can tell it’s cheaper to own than rent in your area when a stress‑tested mortgage plus ownership costs for a similar property are close to or below your current rent, while keeping total repayments under about 30–35% of your after‑tax income. The key is to compare like‑for‑like homes, use realistic interest rate buffers and include all the hidden ownership costs.
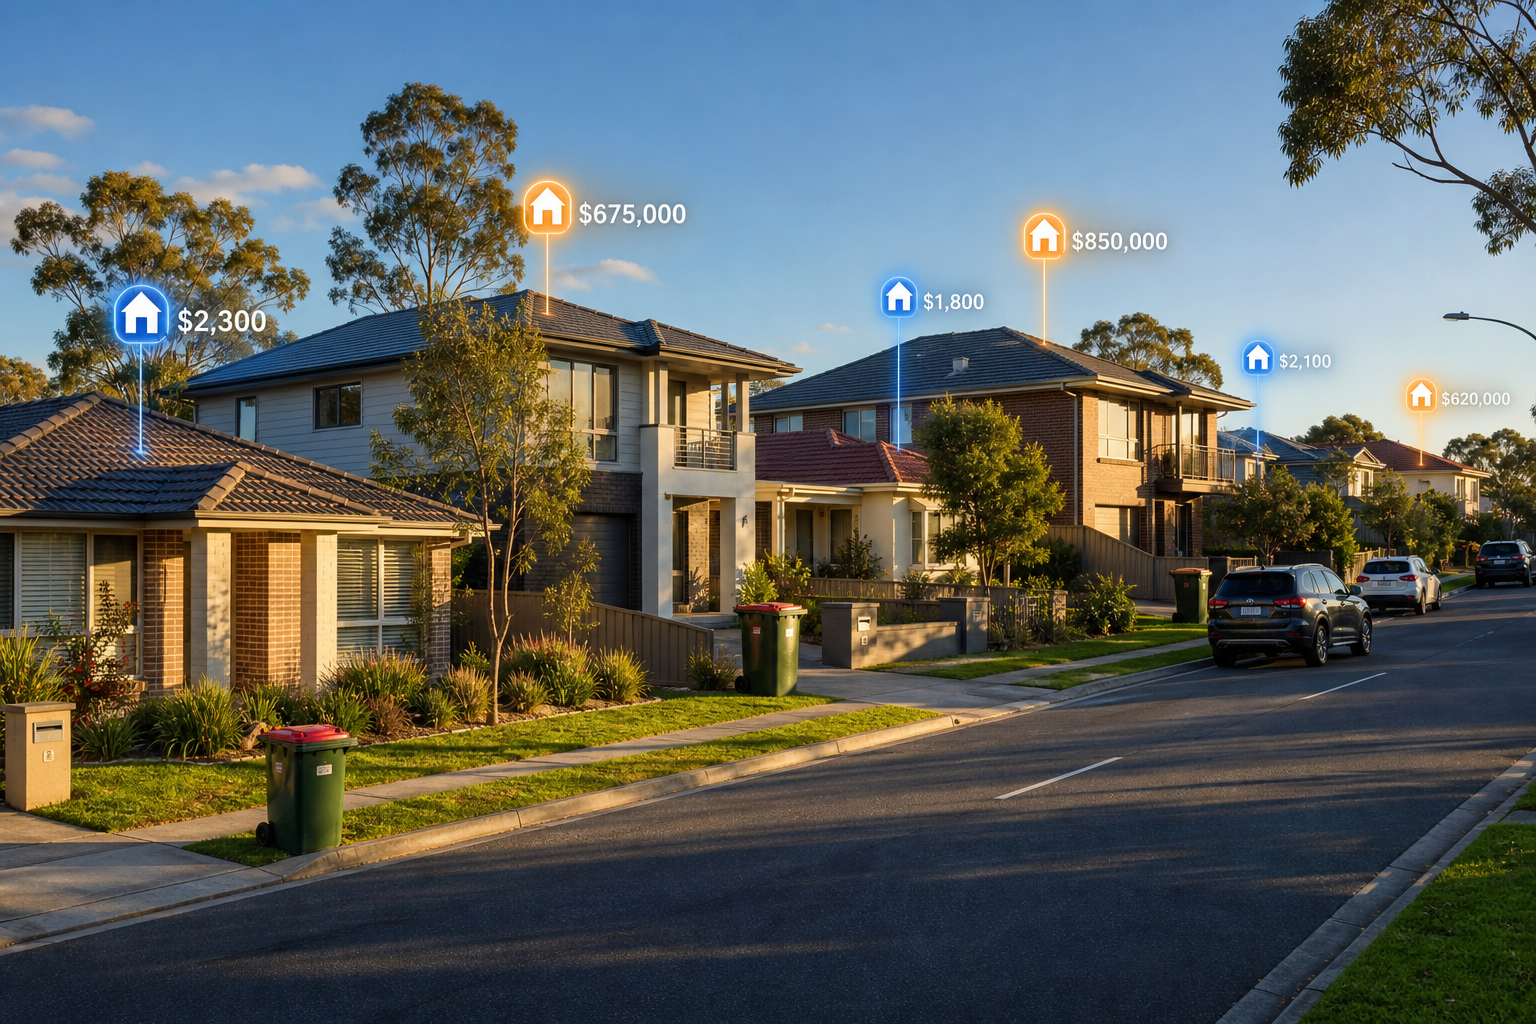
Step 1: Define the exact decision you’re making this week
Before opening a rent vs buy calculator, be clear what you’re actually choosing between.
Common real decisions
- Keep renting here vs buying nearby (similar property, nearby suburb).
- Keep renting here vs rentvesting (keep renting where you love, buy where you can afford).
- Renew lease vs buy now vs wait 12–24 months (especially for first‑home buyers).
- Upgrade and keep old home as investment vs sell and buy next home (owners and investors).
Each decision needs slightly different numbers, but the process is the same: compare your rent with your realistic ownership costs, not generic averages.
If you’re a first‑home buyer using schemes like FHBG or FHSS, your local concessions can tilt the maths — see the Alexandria‑focused guide on using FHBG, FHSS and NSW concessions safely at [/insights/first-home-buyers-alexandria-using-fhbg-fhss-nsw-concessions-safely].
Step 2: Calculate your local cost to own
2.1 Start with a realistic purchase price
Look at recent sales of similar properties in your immediate area. For a quick decision this week, use:
- Lower end of recent sale prices for your target property type; and
- A modest discount (2–3%) if the market is soft, or no discount if competition is strong.
Assume a 20% deposit if you want to avoid LMI, or lower if you’re comfortable with LMI and qualify for a scheme.
2.2 Work the mortgage number (with buffer)
Use a P&I repayment at today’s rates plus a 3% buffer (APRA’s typical serviceability buffer). Example:
- Property price: $800,000
- Deposit: 20% ($160,000)
- Loan: $640,000
- Actual rate example: 6.2% p.a. (illustrative only)
- Buffer test rate: 9.2% p.a.
- Term: 30 years
At 9.2%, repayments are roughly $5,230 per month.
If your household after‑tax income is $14,000 per month, this is about 37% of net income — already above the 30–35% range many brokers use for comfort, especially with Roy Morgan estimating over a quarter of mortgage holders are already at risk of stress.
So for this household, $800,000 may be too tight unless:
- One income is about to rise; or
- You’re very secure and happy to live lean; or
- You buy a little cheaper.
2.3 Add the non‑negotiable ownership costs
On top of the loan, you need to allow for:
- Council rates: say $2,000–$3,000 p.a.
- Strata (for units/townhouses): $3,000–$8,000+ p.a. depending on amenities.
- Building insurance (for houses): maybe $1,500–$2,500 p.a.
- Maintenance: a rule of thumb is 1% of property value p.a. averaged over time.
Table: illustrating annual vs monthly ownership costs.
| Item | Annual estimate | Monthly equivalent |
|---|---|---|
| P&I repayments (buffer) | $62,760 | $5,230 |
| Council rates | $2,400 | $200 |
| Strata / building ins. | $3,600 | $300 |
| Maintenance allowance | $8,000 | $670 |
| Total ownership cost | $76,760 | $6,400 |
So owning this $800k place costs about $6,400 per month when properly stress‑tested.
Step 3: Compare to your real rent today
Now line this up against your rent for a comparable home.
Say you’re currently paying $1,000 per week for a similar property:
- Weekly rent: $1,000
- Monthly equivalent: ~$4,330
Compared to the $6,400 stress‑tested ownership cost, renting is clearly cheaper on cashflow.
But that’s not the full picture. You’re also:
- Missing out on principal you’d otherwise be repaying; and
- Being exposed to rent rises — and rents have been rising strongly with low vacancy rates and higher construction costs.
For a more detailed 10‑year comparison, see the Eastern Suburbs worked examples at [/insights/local-rents-vs-buying-costs-eastern-suburbs-owning-vs-renting].
The strategy continues below
You've seen the problem and the groundwork — now unlock the exact steps our CPA-certified brokers use, including 4 more sections. Enter your email for instant, free full access.
Free access. No spam — unsubscribe anytime. Your details stay confidential.
Frequently asked questions
When is it actually cheaper to buy than rent in Australia?▾
How do I compare my rent with a mortgage properly?▾
Should I use a rent vs buy calculator for my decision?▾
When does rentvesting make more sense than buying my home?▾
Is now a bad time to buy with interest rates so high?▾
Speak with a specialist advisor
Confidential consultation, bespoke advice for your situation.