Article
Solar Savings vs Loan Repayments: A Step‑By‑Step Modelling Example
Use this worked example to compare solar bill savings with loan repayments, find your breakeven point and decide if solar stacks up for your home or investment.
Key Takeaway
This article shows how to model solar savings against loan repayments using a step‑by‑step worked example, helping Australian households decide if solar pays for itself. It estimates conservative bill savings, compares them to repayments under different loan structures, and stress-tests results with a 3% higher interest rate buffer. The guide ends with a simple checklist and breakeven test, giving readers a repeatable framework to plug in their own figures and act within a week.

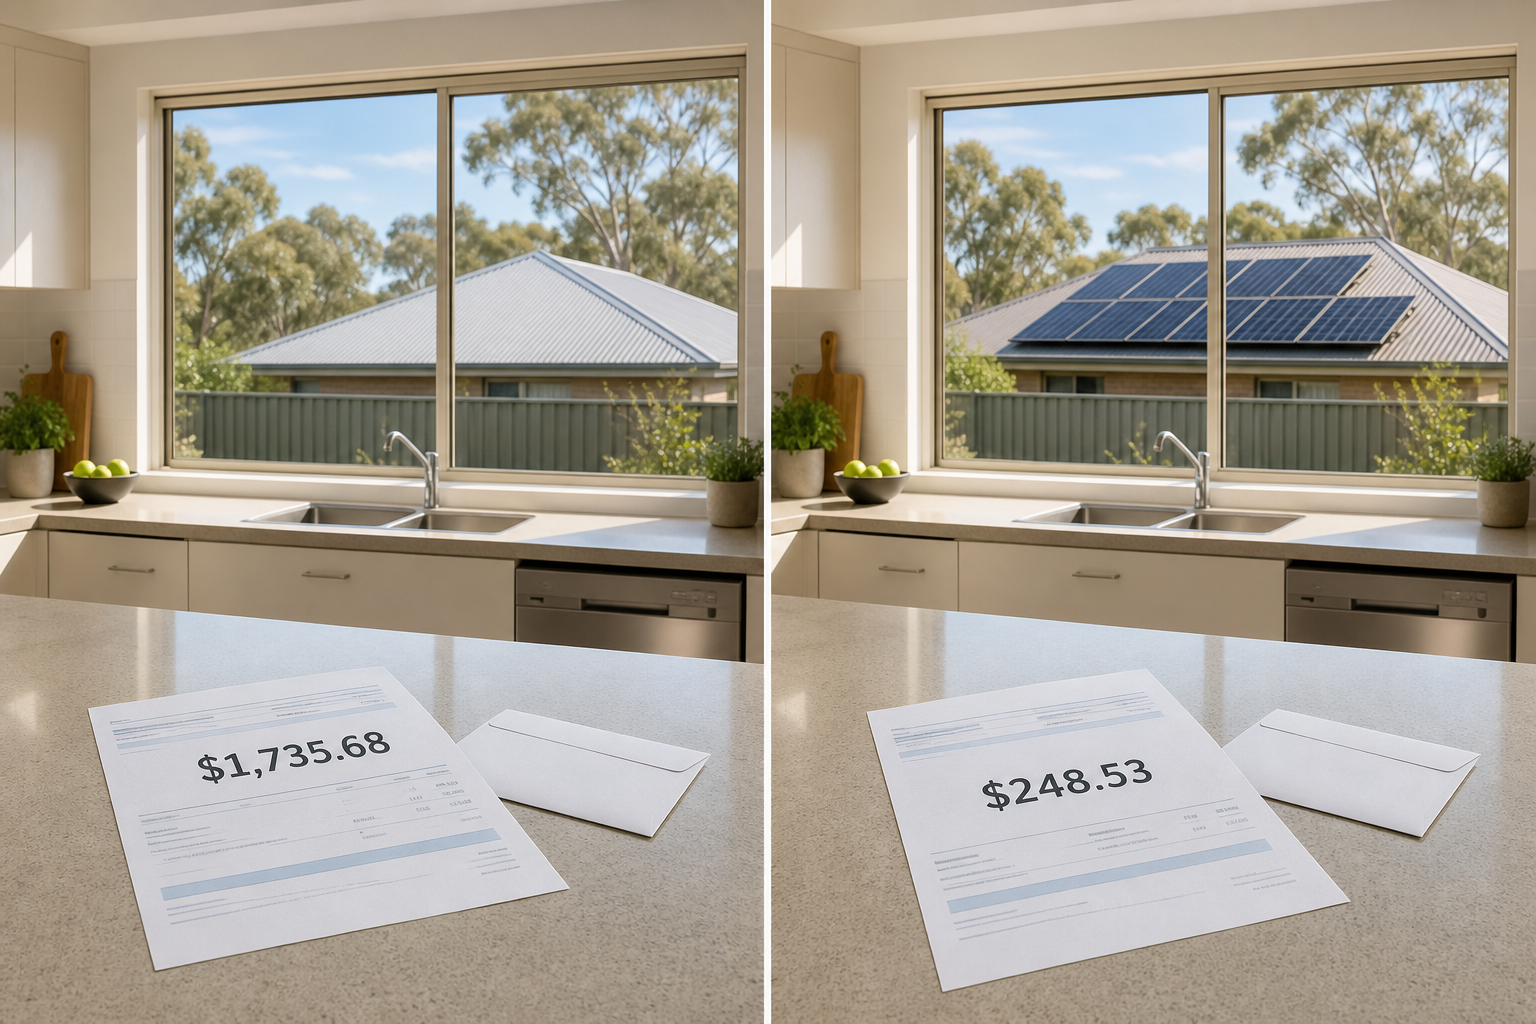
Installing solar only makes financial sense if the bill savings at least come close to covering the extra loan repayments over time. To test this, you need to model both sides: realistic energy savings and the cost of funding the system, then see how they compare under a few scenarios.
This guide walks through a simple, decision‑grade worked example you can copy. We’ll estimate solar savings, model three common finance options, compare repayments, and run a breakeven and stress test so you can decide confidently this week.
1. The core idea: compare savings to repayments, not just “years to pay back”
Most solar quotes show a “payback period” in years. That’s useful, but it hides the month‑to‑month cashflow question you actually care about:
In the next few years, will solar lower or increase my monthly outgoings once loan repayments are included?
The practical way to answer this is:
- Estimate annual bill savings conservatively.
- Work out annual loan repayments for how you plan to fund the system.
- Compare the two and test a few less‑rosy scenarios.
If savings are well above repayments in conservative assumptions, solar is likely a good cashflow decision. If they barely match, or fall short, you’re probably relying on optimistic sunshine or price rises to break even.
This is the same logic we use for batteries and EV chargers: if conservative annual savings don’t come close to covering repayments, the upgrade is probably marginal (see /insights/borrowing-batteries-ev-chargers-future-proofing-overcapitalising).
2. Our worked example: a typical Sydney household
We’ll use a realistic scenario you can adapt to your own numbers.
2.1 Household and property
- Location: Sydney metro
- Property: owner‑occupied house with good north‑facing roof
- Usage: family of four, both adults working, kids in school
- Tariff: single‑rate electricity, around $0.32/kWh plus daily supply charge
2.2 Current power bills (no solar)
- Average quarterly bill: $650
- Annual bill: $650 × 4 = $2,600
- Daily usage from bill: about 20 kWh/day
You can find your own usage on the last page or two of your power bill.
2.3 Proposed solar system
From a competitive, good‑quality quote (after STC rebate):
- System size: 6.6 kW
- Inverter: 5 kW, reputable brand
- Total installed price (cash): $7,000 including GST
- Expected generation: 9,500 kWh/year (typical for 6.6 kW in Sydney with good orientation)
If you’re still at quote stage, read your offers carefully – inclusions and warranties matter as much as price. Our separate guide shows how to spot red flags: /insights/reading-solar-quotes-inclusions-warranties-finance-traps.
3. Step 1 – Estimate conservative solar savings
You’ll see big numbers on many solar sales pages. For decision‑grade modelling, you want conservative numbers you’d be comfortable using in a bank application or business plan.
3.1 How solar saves you money
Savings come from two sources:
- Self‑consumption – power your household uses directly from the panels instead of buying from the grid.
- Feed‑in tariff (FiT) – the credit you get for excess energy exported to the grid.
In most cases, self‑consumption is worth more per kWh than exports, because your usage tariff is usually higher than your FiT.
3.2 Key assumptions for our example
- Retail usage tariff: $0.32/kWh
- Feed‑in tariff: $0.08/kWh (varies by retailer)
- Self‑consumption rate: 40% of solar power used on site
- Exported: 60% of solar power sent to grid
- Annual generation: 9,500 kWh
These are intentionally on the conservative side for a working family who aren’t home all day.
3.3 Calculate annual savings
-
Self‑consumed energy
- 40% of 9,500 kWh = 3,800 kWh
- Value: 3,800 kWh × $0.32 = $1,216/year
-
Exported energy
- 60% of 9,500 kWh = 5,700 kWh
- Value: 5,700 kWh × $0.08 = $456/year
-
Total estimated annual benefit
- $1,216 + $456 = $1,672/year
-
New net annual bill
- Original $2,600 – $1,672 = $928/year (plus any small changes in daily supply charges)
So on these assumptions, solar cuts this household’s power cost by roughly $1,700 per year, or around $140 per month.
When you run your own numbers, it’s wise to also model a 10–20% lower generation scenario (cloudier years, shading, degradation) and a lower FiT in case retailers cut rates.
4. Step 2 – Choose a funding method to model
Now we compare those savings to the cost of funding the $7,000 system. There are three common options:
- Add it to your existing home loan (equity top‑up / new split)
- Take a separate green/personal loan
- Use the installer’s own solar finance
We’ve covered the pros and cons of these structures in detail here:
For this worked example, we’ll keep the maths simple and just model repayments.
Important: We’ll use indicative interest rates only. Always check current offers and terms – and don’t assume installer finance is cheaper just because it’s marketed as “0% interest”. The total financed price can be much higher than a cash quote.
4.1 Option A – Add solar to home loan (short split)
Assumptions:
- Extra borrowing: $7,000
- Loan type: separate home loan split for solar
- Term: 7 years (84 months) – short on purpose
- Rate: 6.5% p.a. principal & interest (P&I)
Using a standard repayment formula or calculator:
- Monthly repayment ≈ $104
- Annual repayment ≈ $1,248
4.2 Option B – Bank green loan / unsecured personal loan
Assumptions:
- Loan amount: $7,000
- Term: 5 years (60 months)
- Rate: 9.5% p.a. P&I
Result:
- Monthly repayment ≈ $147
- Annual repayment ≈ $1,764
4.3 Option C – Installer finance
Installer finance deals vary a lot. Some:
- Inflate the system price
- Add monthly account fees
- Offer teaser periods with low or zero repayments, followed by a jump (a repayment cliff – see /insights/bank-green-loans-vs-solar-installer-finance).
Assumptions for our example:
- Advertised system price (financed): $8,500 (vs $7,000 cash)
- Term: 10 years (120 months)
- Implicit rate (embedded in higher price and fees): ~12% p.a.
Approximate repayment:
- Monthly repayment ≈ $122
- Annual repayment ≈ $1,464
We’ll compare these three in a table shortly.
The strategy continues below
You've seen the problem and the groundwork — now unlock the exact steps our CPA-certified brokers use, including 7 more sections. Enter your email for instant, free full access.
Free access. No spam — unsubscribe anytime. Your details stay confidential.
Frequently asked questions
How do I quickly tell if solar will be cashflow positive for me?▾
Should I add solar to my home loan or use a green loan?▾
Are solar installer ‘0% interest’ deals really interest free?▾
How do I allow for future electricity price rises in my modelling?▾
What if my household power usage changes after installing solar?▾
Does solar change my borrowing power for a home or investment loan?▾
Speak with a specialist advisor
Confidential consultation, bespoke advice for your situation.